Moonhub IndexMoonhub Index combines several popular technical indicators to create an aggregated index that aims to give a clearer overall picture of the market. The index takes into account the current market condition (trending, ranging, or volatile) to adjust its calculations accordingly.
The indicators used in this composite index are:
Hull Moving Average (HMA)
Fisher Transform (FT)
Williams Alligator
Moving Average Convergence Divergence (MACD)
Average True Range (ATR)
On-Balance Volume (OBV)
Money Flow Index (MFI)
Accumulation/Distribution (AD)
Pivot Points
True Strength Index (TSI)
Volume-Weighted Average Price (VWAP)
The script calculates the values of each indicator and then normalizes and weighs them according to predefined weights. The composite index is formed by summing the weighted values of each indicator. The final Moon Index is plotted on the chart, along with several other related lines like the exponential moving averages (EMA) and simple moving averages (SMA) of the index.
This custom index can be used by traders to get a more comprehensive view of the market and make better-informed trading decisions based on the combined insights of multiple indicators.
在脚本中搜索"pivot points"

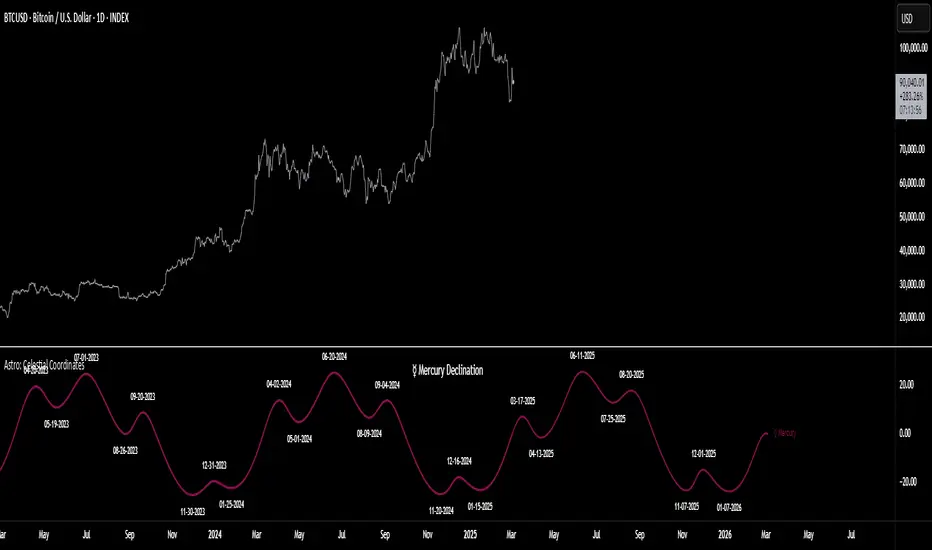
Astro: Celestial CoordinatesCelestial coordinates are a system of measurements used in astronomy and astrology to describe the positions of celestial objects such as stars, planets, and constellations. There are several different celestial coordinates, including right ascension (RA), longitude, latitude, declination, and altitude. Each coordinate has its own astronomical or astrological significance, as outlined below:
Right ascension (RA) is a coordinate used to describe the position of an object in the sky along the celestial equator. It is measured in hours, minutes, and seconds and is analogous to longitude on Earth. RA is significant in both astronomy and astrology because it allows astronomers and astrologers to accurately locate celestial objects in the sky.
Longitude is a coordinate used to describe the position of a planet or other object in its orbit around the Sun. It is measured in degrees and is significant in astronomy because it allows astronomers to accurately predict the positions of planets and other objects in the solar system.
Latitude is a coordinate used to describe the position of an object in the sky relative to the celestial equator. It is measured in degrees and is significant in both astronomy and astrology because it helps astronomers and astrologers to determine the positions of celestial objects in the sky.
Declination is a coordinate used to describe the position of an object in the sky relative to the celestial equator, similar to latitude but measured in degrees north or south of the celestial equator. It is significant in astronomy because it allows astronomers to accurately locate objects in the sky.
Altitude is a coordinate used to describe the height of an object above the horizon. It is measured in degrees and is significant in both astronomy and astrology because it allows astronomers and astrologers to determine when objects will be visible in the sky and at what angle.
In astrology, celestial coordinates are used to create maps of the positions of celestial objects. This indicator plots the corresponding celestial coordinate
values for each planet, moon, or sun and labels key turning (pivot) points with a date (& optional time). Hover over labels for additional information.
ADX trend reversal/continuation spotterThis indicator is based on ADX and uses a method based on pivot points to identify a possible trend reversal or trend continuation.
To better understand how to use this indicator, follow these instructions:
Check which type of line ADX is below/above.
If the ADX line is above the green line and has changed color, you can expect a possible trend change.
Similarly, if the ADX line is below the red line and has changed color, you can expect a continuation of the previous trend or a possible trend uptake based on the current situation in the chart.
FX:EURUSD

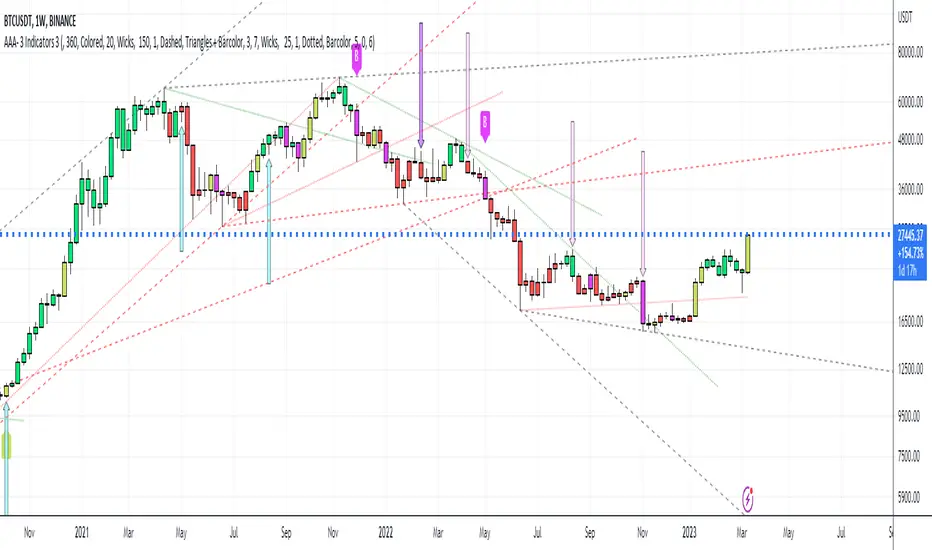
Trendlines 2x ver. 5 plus GMMA modifiedthis is a copy of "Trendlines 2x +" Script by Lij_MC (but converted to Version 5 of Pine script), which draws trendlines from the pivot points in the price chart and also add some arrows from "Guppy Multiple Moving Averages" Indicator by optictropic for trend confirmation.
I Change this code from Pine script 4 to 5 to add some functionalities to it.
Some adjustments of parameters have been made by me to easy recognition of Trendline breaks.
These parameters are in the original code, but I make them default for nicer look of the indicator and easier recognition of Trendline breaks.
for example, breaking the primary trendlines are shown by color change of the candles and in the same time by a Break symbol as a label.
breaking the secondary trendlines are shown only by candle color. Extension of the secondary trendlines are set to 50 candles to better recognize the past trendlines .
color candles are set to default to easily see the trend direction of the chart.
I have also added some arrows by the help of "Guppy Multiple Moving Averages" indicator by optictropic, that can be used for confirmation of trend direction.
I think this can represent good looking trend direction and trendline breaks can help traders for a better trade decision.
for better trading with this indicator, buy when you have green or lime color for candles, and GMMA gives UP long arrow signals, check higher time frames, and at last, this is only a help but not a final decision making indicator. you must have your own price action analysis.
best wishes
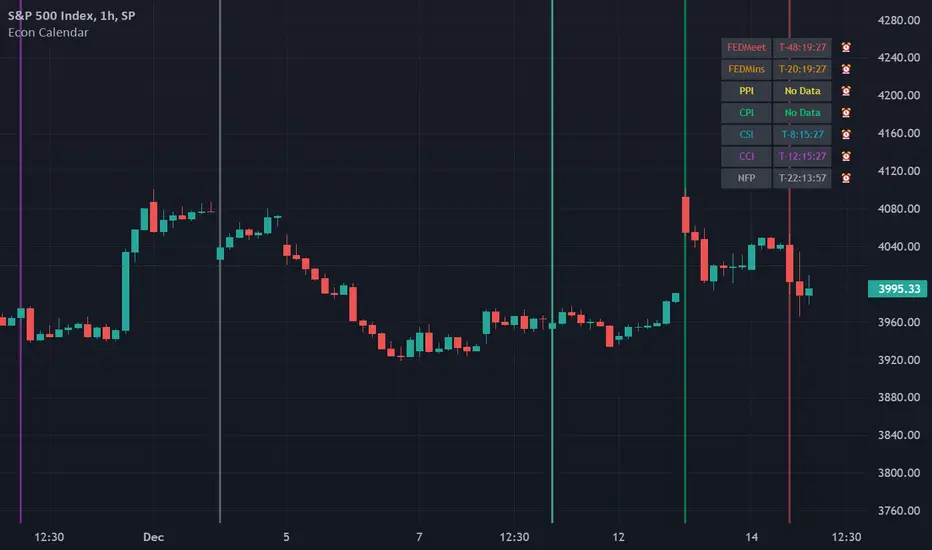
Odd_mod Econ CalendarA modification of Economic Calendar Events: FOMC, CPI, and more written by jdehorty . Please send all tips his way as he is maintaining the underlying data for the Calendar and the original concept.
List of changes:
Optimized code, will only run once on initialization now(No random line in middle of screen on bar change)
Legend - Added short names
Legend - Removed header
Legend - Made repositionable with selectable top margins
Legend - Removed data name from legend when it is disabled
Legend - Removed border
Original Description by jdehorty :
This script plots major events from the Economic Calendar that often correspond to major pivot points in various markets. It also includes built-in logic to retroactively adjust larger time intervals (i.e. greater than 1 hour) to be correctly aligned with the interval during which the event occurred.
Events are taken from the Economic Calendar and will be updated periodically at the following library:
EconomicCalendar
The above library can be used to conveniently access date-related data for major Meetings, Releases, and Announcements as integer arrays, which can be used in other indicators. Currently, it has support for the following events:
FOMC Meetings
The FOMC meets eight times a year to determine the course of monetary policy . The FOMC's decisions are based on a review of economic and financial developments and its assessment of the likely effects of these developments on the economic outlook.
FOMC Minutes
The FOMC minutes are released three weeks after each FOMC meeting. The minutes provide a detailed account of the FOMC's discussion of economic and financial developments and its assessment of the likely effects of these developments on the economic outlook.
Producer Price Index (PPI) Releases
The Producer Price Index (PPI) measures changes in the price level of goods and services sold by domestic producers. The PPI is a weighted average of prices of a basket of goods and services, such as transportation, food, and medical care. PPI is a leading indicator of CPI .
Consumer Price Index ( CPI ) Releases
The Consumer Price Index ( CPI ) measures changes in the price level of goods and services purchased by households. The CPI is a weighted average of prices of a basket of consumer goods and services, such as transportation, food, and medical care. CPI is one of the most widely used measures of inflation .
Consumer Sentiment Index ( CSI ) Releases
The University of Michigan's Consumer Sentiment Index ( CSI ) is a measure of consumer attitudes about the economy. The CSI is based on a monthly survey of U.S. households and reflects the consumers' assessment of present and future economic conditions. The CSI is a leading indicator of consumer spending, which accounts for about two-thirds of U.S. economic activity.
Consumer Confidence Index ( CCI ) Releases
The Consumer Confidence Index is a survey that measures how optimistic or pessimistic consumers are regarding their expected financial situation.
Non-Farm Payroll (NFP) Releases
The Non-Farm Payroll (NFP) is a measure of the change in the number of employed persons, excluding farm workers and government employees. The NFP is a leading indicator of consumer spending, which accounts for about two-thirds of U.S. economic activity.
Liquidity Levels MTF - SonarlabThis indicator uses Pivot Points to identify Liquidity Levels in the market. Liquidity Levels are levels in the market where you would expect price to be pulled towards.
Liquidity Levels by Sonarlab also has an option to show Higher Timeframe Liquidity Levels.
Below are the indicators settings:
Liquidity Mitigation Options
The Indicator has options for you to choose what happens to the Liquidity line/boxes once it has been mitigated. Either Keep them on the chart, or remove them.
Display Styles
Choose how the levels are displayed, either with Lines or Boxes.
Set the your Extension options, by keeping the lines/boxes "short" or extend to current price, or maximum to the right
Colors and Styles
Set colors and styles for all lines and boxes

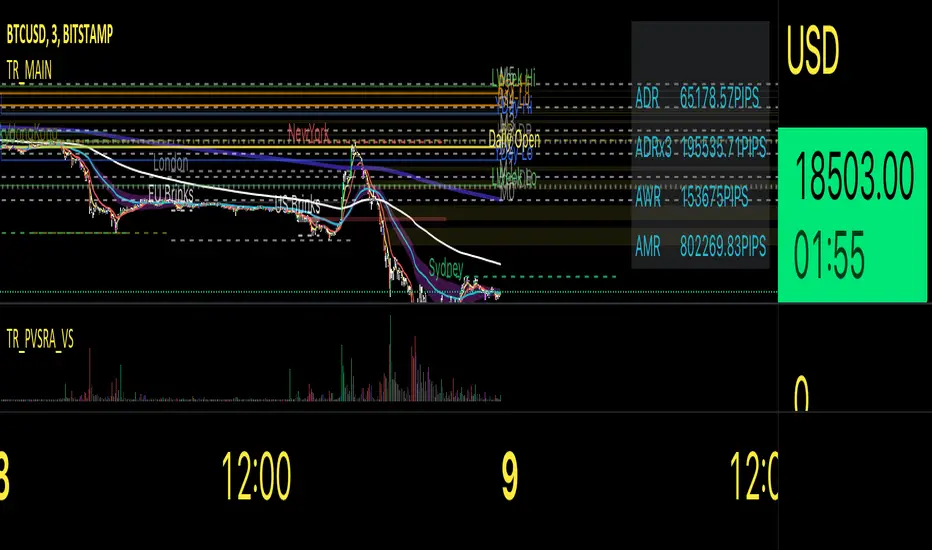
Traders Reality MainThis indicator serves as the Tradingview equivalent of an MT4 indicator suite.
It differentiates from existing TV indicators in its style and total feature set (most notably PVSRA and PVSRA Override)
It was originally designed for forex markets, and it will work for crypto as well, but it has not been tested on stocks.
List of features:
PVSRA Candles
Market boxes (NY/JP/ HK /UK/ FR and Brinks Boxes)
5/13/50/200/800 EMAs (cloud for 50EMA)
Pivot points (S/M/R 1,2,3; PP )
Yesterday and Last Week price range
Average Daily Range (Weekly and Monthly as well)
Daily Open
PVSRA Override
Psychological High/Low
Vector Candle Zones
All of these are configurable in the indicator settings.
Usage instructions:
PVSRA Candle colors meaning:
Green (bull) and red (bear): Candles with volume >= 200% of the average volume of the 10 previous chart candles, and candles where the product of candle spread x candle volume is >= the highest for the 10 previous chart time candles.
Blue (bull) and blue-violet (bear): Candles with volume >= 150% of the average volume of the 10 previous chart candles
PVSRA Override
In order to get reliable bar coloring, we need accurate data. If you're on a chart with low volume on some obscure exchange, you may want to use another exchanges datafeed for the symbol you are on to calculate the PVSRA bar colors with. This lets you do exactly that. By default it's off, but you can turn it on and use INDEX:BTCUSD, or really any other chart you want. You can combine charts too, e.g. use BINANCE:BTCUSDT+COINBASE:BTCUSD.
PVSRA Alerts
Alerts can be made for PVSRA "vector"/"climax" candles:
1. Create Alert (Clock with + sign)
2. Set Condition: "Traders Reality",
3. Select "Alert on Vector Candle",
4. Set it to Once per Bar,
5. choose your notification options.
Market boxes
The market boxes times are configurable and will change depending on the exchange timezone. I recommend to pick your main exchange/chart and adjust the times so that they are correct. Technically you will need to shift the time from the exchanges' timezone to GMT . Default values should be good for UTC based exchanges in current US+UK summer time.
Psychological High/Low
Configurable for Crypto or Forex - draws the perceived Psychological High/Low ranges for the week. Can display historical values too.
Vector Candle Zones
displays unrecovered liquidity left behind on unrecovered vectors. Configurable to take into account candle bodies or candles and wicks.
Recommended additional Tradingview indicator(s):
- TDI - Goldminds, Edited for Market Makers Method by Jakub Donovan
Footnotes
The code was originally by plasmapug, continued development (with permission) is now done by infernix and peshocore and xtech5192 in collaboration with TradersReality.
If you have suggestions or questions, you can message me or leave a comment.
Economic Calendar Events: FOMC, CPI, and moreThis script plots major events from the Economic Calendar that often correspond to major pivot points in various markets. It also includes built-in logic to retroactively adjust larger time intervals (i.e. greater than 1 hour) to be correctly aligned with the interval during which the event occurred.
Events are taken from the Economic Calendar and will be updated periodically at the following library:
The above library can be used to conveniently access date-related data for major Meetings, Releases, and Announcements as integer arrays, which can be used in other indicators. Currently, it has support for the following events:
FOMC Meetings
The FOMC meets eight times a year to determine the course of monetary policy. The FOMC's decisions are based on a review of economic and financial developments and its assessment of the likely effects of these developments on the economic outlook.
FOMC Minutes
The FOMC minutes are released three weeks after each FOMC meeting. The minutes provide a detailed account of the FOMC's discussion of economic and financial developments and its assessment of the likely effects of these developments on the economic outlook.
Producer Price Index (PPI) Releases
The Producer Price Index (PPI) measures changes in the price level of goods and services sold by domestic producers. The PPI is a weighted average of prices of a basket of goods and services, such as transportation, food, and medical care. PPI is a leading indicator of CPI.
Consumer Price Index (CPI) Releases
The Consumer Price Index (CPI) measures changes in the price level of goods and services purchased by households. The CPI is a weighted average of prices of a basket of consumer goods and services, such as transportation, food, and medical care. CPI is one of the most widely used measures of inflation.
Consumer Sentiment Index (CSI) Releases
The University of Michigan's Consumer Sentiment Index (CSI) is a measure of consumer attitudes about the economy. The CSI is based on a monthly survey of U.S. households and reflects the consumers' assessment of present and future economic conditions. The CSI is a leading indicator of consumer spending, which accounts for about two-thirds of U.S. economic activity.
Consumer Confidence Index (CCI) Releases
The Consumer Confidence Index is a survey that measures how optimistic or pessimistic consumers are regarding their expected financial situation.
Non-Farm Payroll (NFP) Releases
The Non-Farm Payroll (NFP) is a measure of the change in the number of employed persons, excluding farm workers and government employees. The NFP is a leading indicator of consumer spending, which accounts for about two-thirds of U.S. economic activity.

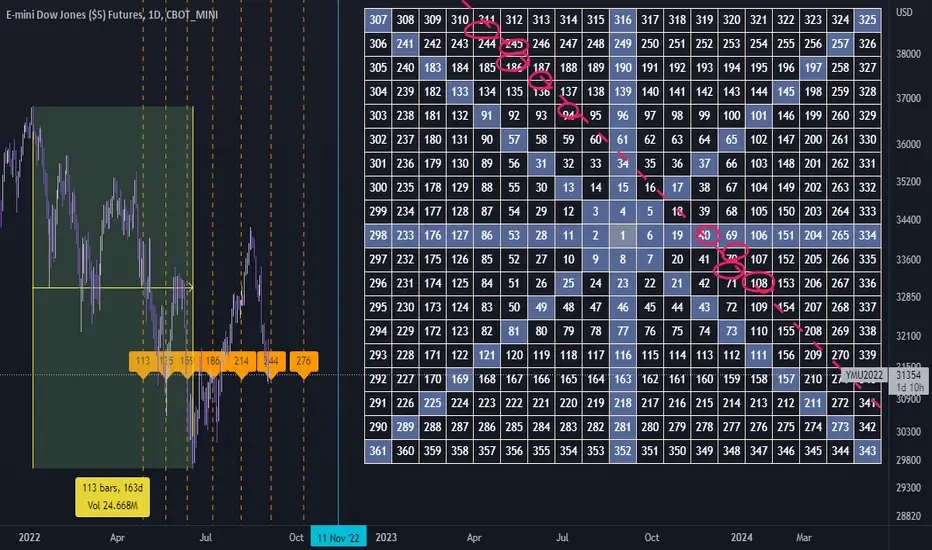
Gann Square This indicator build by Gann Square of 19.
you select start and end of big trend in daily timeframe and calculate date range.
by draw trend line in Gann square and enter the numbers cross by line in settings input you could recognize future pivot points
remember : first) this tool worked only in daily timeframe. second) better using this in dark theme :)
chart example :
DMI StrategyThis strategy is based on DMI indicator. It helps me to identify base or top of the script. I mostly use this script to trade in Nifty bank options, even when the signal comes in nifty. It can be used to trade in other scripts as well. Pivot points can also be used to take entry. Long entry is taken when DI+(11) goes below 10 and DI-(11) goes above 40, whereas short entry is taken when DI-(11) goes below 10 and DI+(11) goes above 40.
For bank nifty, I take the trade in the strike price for which the current premium is nearby 300, with the SL of 20%. If premium goes below 10% I buy one more lot to average, but exit if the premium goes below 20% of the first entry. If the trade moves in the correct direction, we need to start trailing our stoploss or exit at the pre-defined target.
Please have a look at strategy tester to back test.

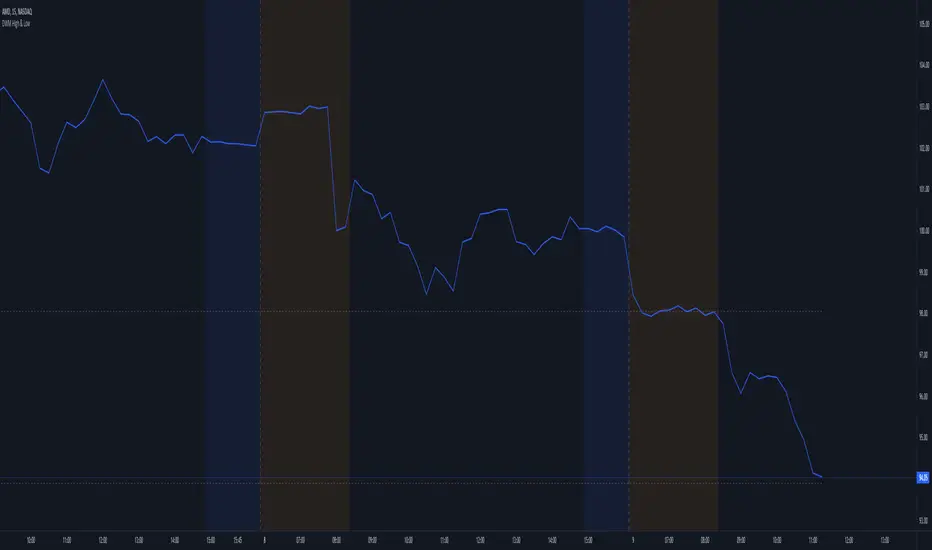
Day Week Month High & LowThis is a small little script that helps visually mark the high and lows of the DAY, WEEK or MONTH (of your choosing). It's best when paired with my High and Low Fibonacci Pivot Points indicator to help emphasize the high and lows of the day, week or month.
CFB Adaptive MOGALEF Bands [Loxx]A Pine Script adaptation from MOGALEF Bands .
What are MOGALEF Bands?
Actual MOGALEF bands code is the final result of a lot of contributors. Syllables MO-GA-LEF are the initials of three of them.
The basic idea of bands: the markets are still in range, and trends that are moving ranges. The Mogalef bands try to estimate the current range and to project its on the future if prices move. This future estimation is often of great relevance and very useful, especialy for market profile users or pivot points users.
What is Composite Fractal Behavior ( CFB )?
All around you mechanisms adjust themselves to their environment. From simple thermostats that react to air temperature to computer chips in modern cars that respond to changes in engine temperature, r.p.m.'s, torque, and throttle position. It was only a matter of time before fast desktop computers applied the mathematics of self-adjustment to systems that trade the financial markets.
Unlike basic systems with fixed formulas, an adaptive system adjusts its own equations. For example, start with a basic channel breakout system that uses the highest closing price of the last N bars as a threshold for detecting breakouts on the up side. An adaptive and improved version of this system would adjust N according to market conditions, such as momentum, price volatility or acceleration.
Since many systems are based directly or indirectly on cycles, another useful measure of market condition is the periodic length of a price chart's dominant cycle, (DC), that cycle with the greatest influence on price action.
The utility of this new DC measure was noted by author Murray Ruggiero in the January '96 issue of Futures Magazine. In it. Mr. Ruggiero used it to adaptive adjust the value of N in a channel breakout system. He then simulated trading 15 years of D-Mark futures in order to compare its performance to a similar system that had a fixed optimal value of N. The adaptive version produced 20% more profit!
This DC index utilized the popular MESA algorithm (a formulation by John Ehlers adapted from Burg's maximum entropy algorithm, MEM). Unfortunately, the DC approach is problematic when the market has no real dominant cycle momentum, because the mathematics will produce a value whether or not one actually exists! Therefore, we developed a proprietary indicator that does not presuppose the presence of market cycles. It's called CFB (Composite Fractal Behavior) and it works well whether or not the market is cyclic.
CFB examines price action for a particular fractal pattern, categorizes them by size, and then outputs a composite fractal size index. This index is smooth, timely and accurate
Essentially, CFB reveals the length of the market's trending action time frame. Long trending activity produces a large CFB index and short choppy action produces a small index value. Investors have found many applications for CFB which involve scaling other existing technical indicators adaptively, on a bar-to-bar basis.
What is Jurik Volty used in the Juirk Filter?
One of the lesser known qualities of Juirk smoothing is that the Jurik smoothing process is adaptive. "Jurik Volty" (a sort of market volatility ) is what makes Jurik smoothing adaptive. The Jurik Volty calculation can be used as both a standalone indicator and to smooth other indicators that you wish to make adaptive.
What is the Jurik Moving Average?
Have you noticed how moving averages add some lag (delay) to your signals? ... especially when price gaps up or down in a big move, and you are waiting for your moving average to catch up? Wait no more! JMA eliminates this problem forever and gives you the best of both worlds: low lag and smooth lines.
Ideally, you would like a filtered signal to be both smooth and lag-free. Lag causes delays in your trades, and increasing lag in your indicators typically result in lower profits. In other words, late comers get what's left on the table after the feast has already begun.
Included:
-Color bars
-Fill levels

RSITrendStrategyI don't know if there is any strategy based on RSI cross over. The strategy is designed based on RSI crossover, considering RSI(5) and RSI(11), with RSI(6) to identify highs & lows.
I used this strategy to trade in Nifty 50 & Nifty bank indices. Whenever there is long mentioned on chart, I go for buying call option with premium near to 300, and placing stoploss of 50 on candle closing basis, vice versa.
Target is open until short is mentioned on the chart. Sometimes, i used standard pivot points as well to mark my targets and also to trail my trades.

SSL HYBRID AdvancedSSL HYBRID Advanced
SSL Hybrid is an Advanced version of the default SSL Hybrid by Mihkel00.
Multiple Indicators
MACD Crossover Signals
EMA 200
Bollinger Band
Bollinger Band Squeeze
ADX Crossover and ADX level
CCI Over Brought /Sold
Stochastic Over Brought /Sold
RSI Over Brought /Sold
CREDITS
QQE MOD byMihkel00
SSL Hybrid by Mihkel00
Waddah Attar Explosion by shayankm
Support Resistance LonesomeTheBlue
Indicators On Chart
QQE MOD is plotted as Dot below and above the candle and also as Background
QQE line is plotted and can be used as crossover to find trend. Flat movement of QQE is Sideways
Weak ADX is plotted as a Background color. Same can be verified using Bollinger band Squeeze.
EMA crossover can be plotted by selecting MTF MA(multi time frame moving average indicator) Area plot is provided.
CCI , Stochastic, RSI signals provided in the table option
WAE (volume indicator ) is shown in Table
EMA 200 is plotted and color Represents ADX level and direction. Plots on EMA 200 are ADX crossovers
MACD crossovers are represented by Triangles above and below Candles
Support Resistance levels are plotted (change settings)
Pivot Points are plotted (change settings)
Bollinger Bands Plotted
EMA 20 and EMA 50 plotted with AREA for additional confirmation
Buy: When the table option shows completely Blue signals in all indicators
Sell: When the table option shows completely Pink signals in all indicators
WARNING not recommended for lower time frames. Use at your own Risk.
Updates will be released shortly if any. please provide your suggestions to make it more functional indicator.

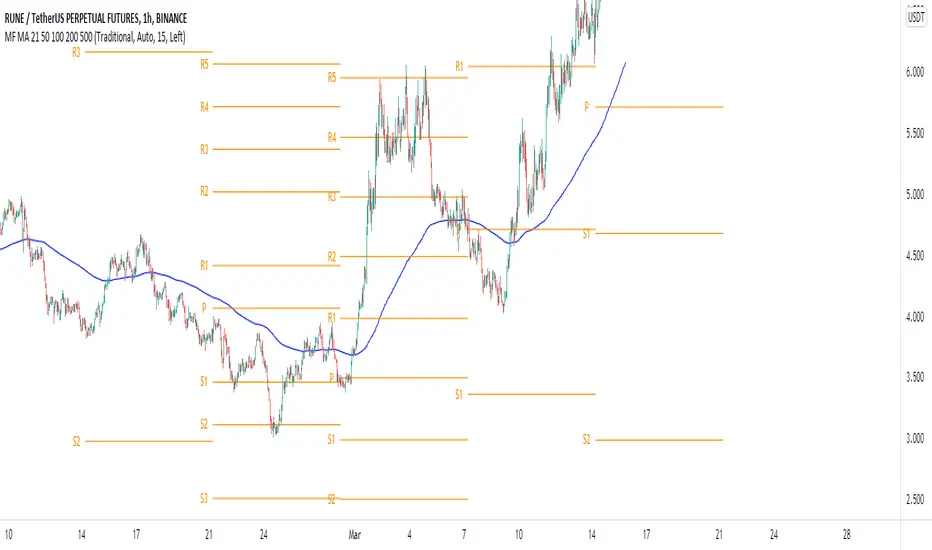
MF 200 EMA PivotPointWe will be using the 200 EMA for identifying the trend of the market & possible cross overs for Swing trades. Pivot points will be really useful for defining the Supports & resistance. By combining with these two strategies we can understand the markets simple & clear. No need to fill your chart with Graphical designs.
RSI Supply / Demand ZonesLines plotted for the Low and High of the region of price that was Overbought or Oversold
(Low of the candle that became overbought and highest high in the Overbought period)
(High of the candle that became oversold and highest high in the Oversold period)
I like to use the dotted lines as pivot points for the reversal of the trend, and also pay attention to small tops and bottoms (normal lines) that form in strong trends, as they usually make for brief periods of acummulation/distribution before the continuation of the strong trend.
